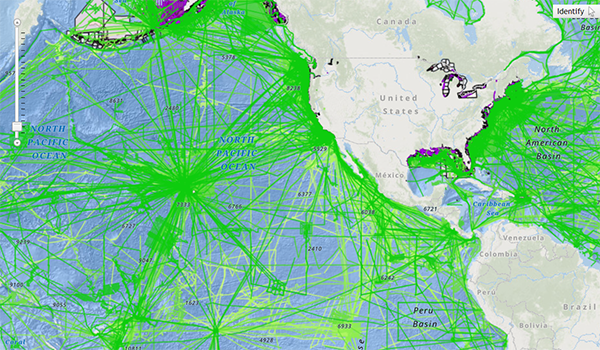
Interactive Bathymetry Map
Get closer than ever with the interactive bathymetry map to learn more.
Interactive Bathymetry Map Read More »
Get closer than ever with the interactive bathymetry map to learn more.
Interactive Bathymetry Map Read More »
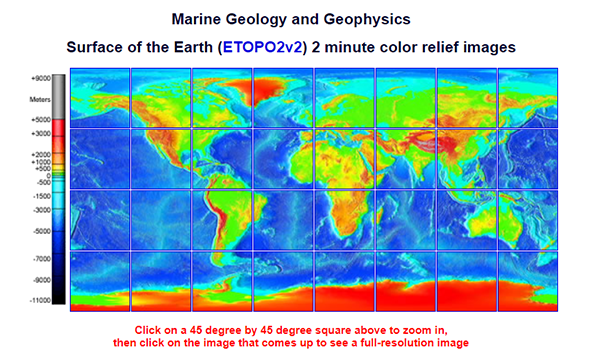
These images were generated from the ETOPO2v2 (2006) database. ETOPO2v2 was created at NGDC from digital databases of seafloor and land elevations on a 2-minute latitude/longitude grid (1 minute of latitude = 1 nautical mile, or 1.852 km). Assumed illumination is from the west; shading is computed as a function of the east-west slope of the surface with a nonlinear exaggeration favoring low-relief areas. A Cylindrical Equidistant projection was used for the world image, which spans 360 degrees of of longitude from 180 West eastward to 180 East; latitude coverage is from 90 degrees North to 90 degrees South. The resolution of the gridded data varies from true 2-minute for the Atlantic, Pacific, and Indian Ocean floors and all land masses to 5 minutes for the Arctic Ocean floor. Clicking on a square above brings up a 512 x 512 pixel color relief image of the 45 degree area selected, clicking on the 512 x 512 image brings up the full-resolution 1350 x 1350 pixel (roughly 3 mb) color image of the area.
Bathymetry and Topography Read More »
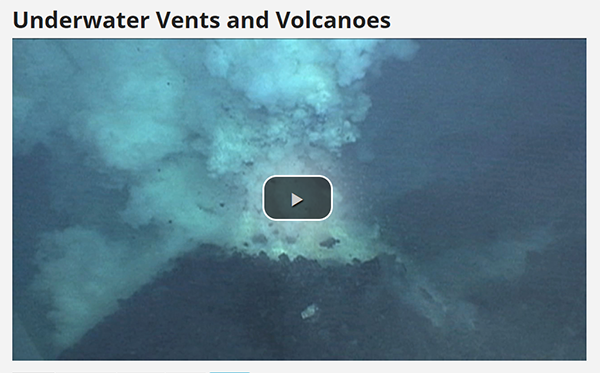
Not too long ago, scientists studying the ocean made a fascinating discovery that has helped us better understand our planet Earth. Down in the deep and dark waters, they found hot springs on the ocean floor releasing warm and mineral-rich fluids – these are called hydrothermal vents.
Underwater Vents and Volcanoes Read More »
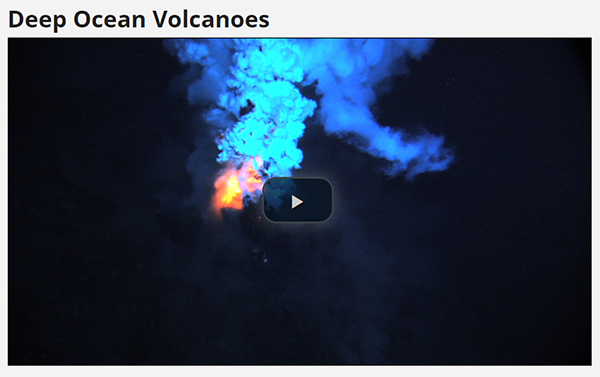
Scientists believe that 80 percent of the volcanic eruptions on Earth take place in the ocean. Most of these volcanoes are thousands of feet deep, and difficult to find. But in May of 2009, scientists captured the deepest ocean eruption ever found.
Deep Ocean Volcanoes Read More »

National Centers for Environmental Information (NCEI) Scientist Nicolas Arcos teams up with Cooperative Institute for Research in Environmental Sciences Scientist Lindsey Wright to explains Tsunamis.
Do You NOAA: Tsunamis Read More »

NOAA’s Physical Sciences Laboratory (PSL) Scientist and Janet Intrieri explains what is happening to Arctic sea ice .
Do You NOAA: Arctic Ice Melt Read More »

Most reef-building corals are made up of hundreds of thousands of individual polyps like this one. These polyps generally range in size from one to three millimeters in diameter.
Anatomy of a coral polyp Read More »

Hydrography is the science that measures and describes the physical features of bodies of water and the land areas adjacent to those bodies of water.

Tsunamis start because of a sudden displacement of ocean water, usually from an earthquake.

World Data Center-A for Marine Geology and Geophysics Report MGG-12 (1996) Published by the National Geophysical Data Center
Age of the Ocean Floor Read More »